This is a little off topic from Magento, but I have found it to be extremely useful setting up XDebug with PHPStorm when developing anything with Magento. You can probably use most of these steps with any other IDE and just replace the PHPStorm specific steps with your IDE ones.
The first and most obvious step, install and setup XDebug in your development environment. I prefer to use a VirtualBox VM running CentOS for development so for that I can just run
yum install php-pecl-xdebug
or
pecl install xdebug
to get the extension added into the system. You will then need to make sure it is being loaded into PHP via /etc/php.d/xdebug.ini. The yum method should automatically create this file for you but, if not, create it with the following inside
; Enable xdebug extension module
; replace the following with the FULL path to xdebug.so
zend_extension=/usr/lib64/php/modules/xdebug.so
Now restart Apache or PHP-FPM and check your phpinfo() (or run `php -i`) and you should see settings for XDebug appearing. If not, double check the path in the INI file and make sure the XDebug extension was compiled for the correct version of PHP running on your machine.
Now we start to get to the good part, setting up XDebug to connect back to your IDE upon request. I prefer to enable the remote_connect_back feature to have PHP connect back to the IP inside $_SERVER[‘REMOTE_ADDR’] whenever the XDebug session key is set. To do that, add the following to your xdebug.ini file after the extension loads:
[xdebug]
xdebug.remote_autostart=0
xdebug.remote_enable=1
xdebug.remote_port=9000
xdebug.remote_connect_back=1
xdebug.remote_handler=dbgp
This sets up XDebug to only attempt to connect back to the remote debugger when the session key is defined in the URL. Restart your Apache or PHP-FPM process again and check to make sure the PHP settings are correct in your phpinfo() screen.
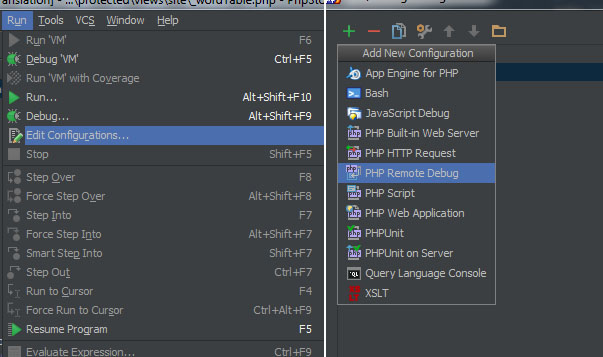
Now that we are done setting up the XDebug settings, we can begin configuring PHPStorm to listen and respond to the incoming XDebug requests. Open up the Run -> Edit Configurations window and create a new PHP Remote Debug:
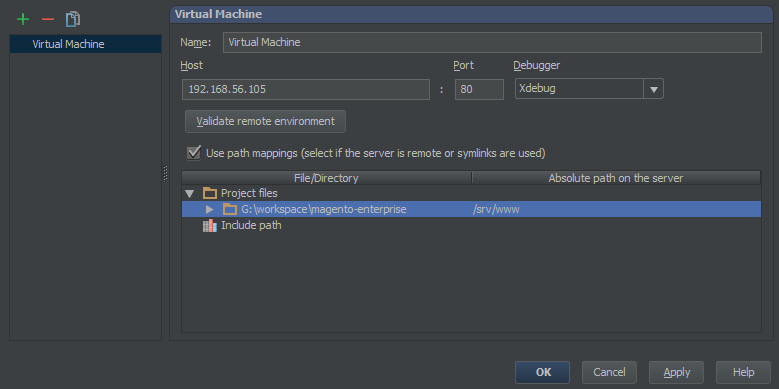
You will then be presented with a form that has a few blank fields but, if you have not setup any servers in the past, the select drop down for servers will be blank. Click the “…” next to this and create a new server configuration. You will just want to make sure XDebug is selected in the Debugger drop down and the “Use path mappings” check box is checked and setup so that PHPStorm and XDebug are looking at the same files.
For example, say you store the website files inside “G:\workspace\magento-enterprise” and deploy them into the VM at “/srv/www”. You will then expand the left side “Project files” to the G:\workspace\magento-enterprise folder, click to the right side of it under the “Absolute path on the server” column and enter in “/srv/www” into the field. Click apply then OK to save this server configuration and be brought back to the PHP Remote Debug screen.
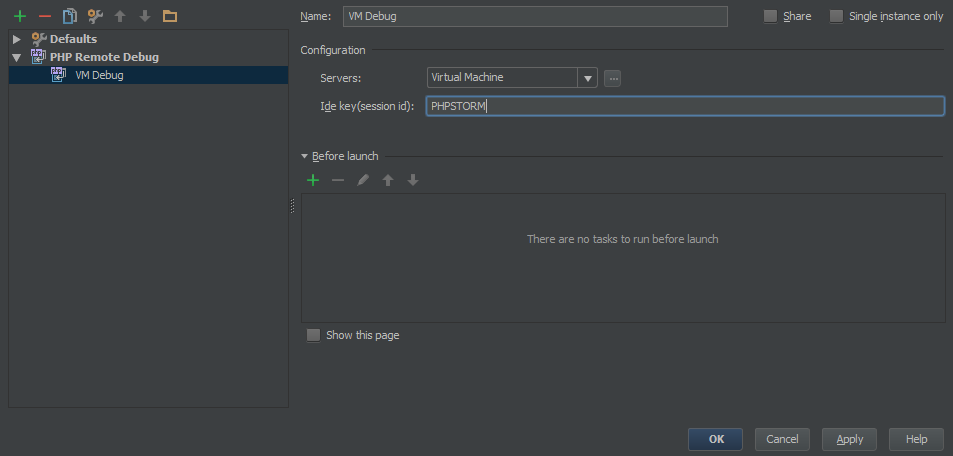
You can now select your newly created server in the Servers drop down and give the PHP Remote Debug a name. You will want to enter something easy to remember for the IDE Key, I tend to use “PHPSTORM” in this field. This is the key that you will need to pass onto URLs to start the remote debugging process that tells XDebug to connect back to PHPStorm. Click Apply then OK to save this debugger into your PHPStorm project settings.
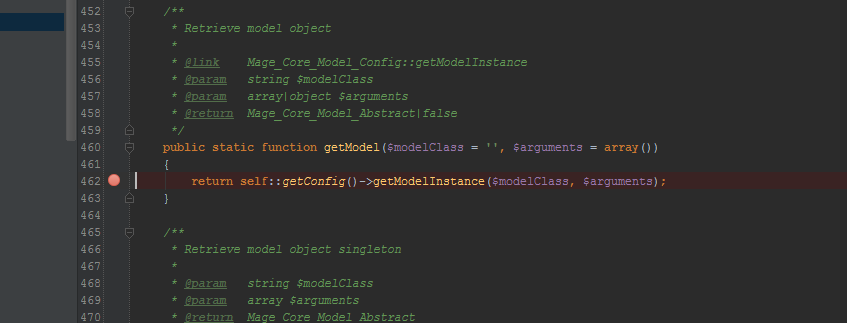
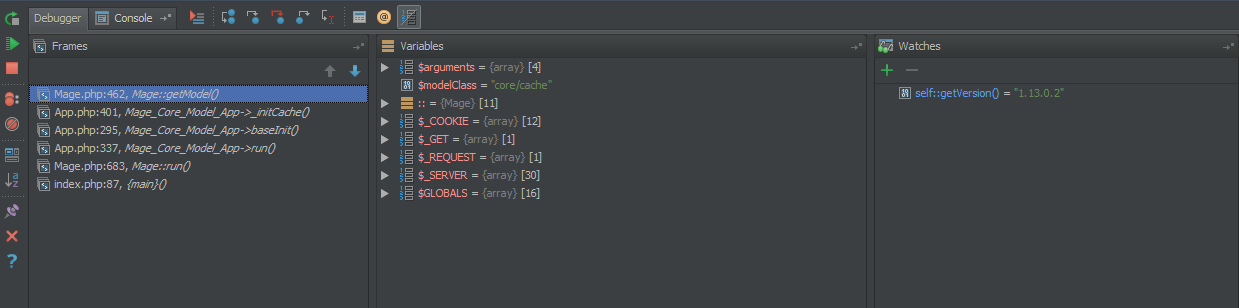
You should now see the newly created PHP Remote Debug inside the drop down at the top right of the PHPStorm window. Select it and click the green bug icon next to it or go to Run -> Debug and click the created configuration to start the debugger process. You will then see a new debug window open at the bottom of PHPStorm, this is where all the XDebug output will appear. It defaults to opening to the Console tab but, in my opinion, the Debugger tab is more useful. Click a line in the grey space between the project file explorer and the code to setup a new break point, you should see a red dot appear where you click to mark the set break point. Make sure it is set to some code that will be executed during page load; the return line in app/Mage.php’s getModel() method for example.
Make sure the debugger windows shows it is waiting for an incoming connection and open the website you setup for debugging in your browser. At this point nothing different should happen but, if you adjust the URL to look like http://192.168.56.105?XDEBUG_SESSION_START=PHPSTORM (adjusted to your URL and IDE Key) and hit enter, you should see the website stop loading and the PHPStorm debugger window freeze execution at the set break point and display all the current variables in scope. You can then click the Step Over and Step Into buttons to move through the code or tell it to just continue running until the next break point with Resume Program.
At this point, XDebug is setup and running with PHPStorm for debugging. If it has issues connecting, verify that the XDebug Debug Port set in File -> Settings -> PHP -> Debug matches what you put in the xdebug.ini file and there is no firewall blocking the connection. I may create more posts in the future on setting up Watches and other nifty features PHPStorm offers but, for now, this at least gets you up and running so you can play around with it.
Nice one, really helpful 🙂
Excellent. Nicely presented and succinct. I would be very interested to see more on Magento and PhpStorm!
I use Codelobster for it: http://codelobster.com/
It has great free PHP debugger.
How’s it helpful in development?
It allows you to set breakpoints and step through the code as it is running. You get to see the value of all variables and can run PHP commands mid-execution to change variable values and modify the execution path if need be. It is great for debugging any issues or bugs that are reported since it gives a lot more control than just putting echo statements everywhere when trying to find out what is going on in the system.